
DAX Is EASY: RANKX vs. RANK in Power BI
Still scratching your head about which DAX function to use for ranking? This one’s for you!

Welcome back to the another post in my DAX is Easy series! My goal here is simple: demystify complex DAX functions with straightforward explanations and practical examples.
And in this edition, we’re diving headfirst into a calculation that pops up constantly: Ranking.
Why Ranking?
Because let's be real, we've all been in situations where users want to instantly spot their top-performing products, star geographies, or just see things neatly ordered. Ranking is that frequent, and that's precisely why I'm going to show you two distinct approaches to nail it in Power BI.
Introduction
As I said, ranking is one of the most common—and at times, surprisingly complex—calculations you'll tackle in Power BI reports. For a long time, RANKX was our go-to, our trusted workhorse. But now, with the "magic" of the new window function RANK in Power BI, we've got a fresh trick up our sleeves!
In this blog, I want to cut through the confusion and make things crystal clear. We'll be using the familiar sample financial dataset available right in Power BI Desktop, so you can follow along, hands-on, with real data.
Ready to dive deeper into understanding ranking with DAX? Let's kick things off!
RANKX
RANKX stands out as one of the primary functions for generating rankings in DAX, and it remains a powerful and effective method to this day. To use the function effectively, one requires a proper understanding of how it works; otherwise, its use becomes intimidating.
Let's break it down with a simple scenario. Imagine you want to rank your products based on the profit they've generated from your financial data. Here’s how you might start👇:

Now let’s dissect RANKX calculation in detail. The first argument, ALLSELECTED, provides a table of all product values visible in the matrix column. If we opted for VALUES/ALL instead of ALLSELECTED, the filter context wouldn’t work correctly. VALUES would give every rank as ‘1’, and ALL would rank based on all products in the entire dataset, regardless of what's shown in your visual.
RANKX then iterates through this table of visible products, calculating [TotalProfit] for each row. As it iterates, there's an active row context for each product.
Since we’re using [TotalProfit], which is a measure, a CALCULATE function is implicitly at play, transforming that row context into a filter context. If you were ranking by a simple column (not a measure), you’d need to wrap that calculation inside CALCULATE yourself to achieve the same effect👇.

Once [TotalProfit] is computed for every single product, RANKX constructs an internal lookup table containing all these profit values. As we've defined (and by default), this lookup table is then sorted in descending (DESC) order.
The Lookup table looks something like this.

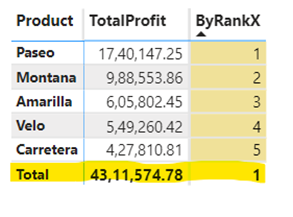
Now, in the second argument of RANKX, we’ve defined the [TotalProfit] measure. RANKX calculates [TotalProfit] for each row in the current filter context. For example, for Velo, it might be 5,59,260.42, for Amarilla, 6,05,802.45, and so on.
Next, the RANKX function searches for that calculated value (e.g. 5,49,260.42) in the already sorted lookup table from the first step. It finds this value in the fourth position, thus returning a rank of '4'. Similarly, for 6,05,802.45, it finds it in the third position, giving a rank of '3', and so forth.
Finally, once the rank values are determined, they’re generated either in a SKIP or DENSE manner, depending on what you’ve specified within the RANKX function. SKIP will, as the name suggests, skip the next rank in case of a tie (e.g., 1, 2, 2, 4), while DENSE assigns the same rank to tied values while maintaining a continuous order (e.g., 1, 2, 2, 3).
And that, my friends, is how the ranks are computed with RANKX!!!
But wait, there's a common hitch we need to address.
If looked closely in the table visual below, you might notice a rank value popping up in the Total row. This isn't ideal—it’s a total, not an individual item to be ranked!
To address this, we can make use of HASONEVALUE or ISINSCOPE function. ISINSCOPE will confirm if the current iteration is within the scope of a single product row, which for the "Total" row would return FALSE. Similarly, HASONEVALUE will tell us if only one value is selected during the calculation, which again, for the "Total" row, would be FALSE. Both lead to a BLANK value for the rank in the total row, cleaning up your visual!.
And with that, we arrive at the most robust expression for generating ranks using RANKX, giving you exactly what you need for visible rows only👇:

RANK
The RANK function, a newcomer in the DAX Functions, operates similarly to the window functions seen in SQL. RANK actually simplifies a couple of common headaches we encounter with RANKX.
Remember how RANKX often throws a rank of '1' into your "Total" and "SubTotal" rows? While we can fix this with HASONEVALUE or ISINSCOPE, that adds an extra layer of complexity we’d often prefer to avoid.
What’s more, when you need to sort rankings based on multiple columns, RANKX can fall short. This is precisely where RANK shines, tackling these issues head-on without demanding a deep dive into its inner workings on your part.
Just take a look at the screenshot below, illustrating how RANK effortlessly generates ranks for products based on profit generated (shown in blue).

Most of the parameters in RANK are akin to those in RANKX, but there’s one key difference: the sorting attribute.
With RANK, you must explicitly specify the sort order using the ORDERBY function. In our example, ORDERBY takes [TotalProfit] as its first argument, forming the bedrock for our sorting. The second argument, DESC, then defines the sorting direction.
As I mentioned, a real advantage here is the ability to include multiple ORDERBY columns within this RANK window function, like in this example👇:
And that’s how simply you can generate ranks using the RANK function! As you can see, it’s often more straightforward to use compared to its predecessor, RANKX.
However, there are still specific scenarios where RANKX might be the better choice, and I’ll be diving into those in an upcoming blog post. Stay tuned!
Conclusion
And that’s a wrap to this part. I hope you now have better understanding on how RANKX and RANK work. In general, you can use RANKX for precise, granular control, and the RANK for streamlined simplicity, especially with subtotals and multiple sort columns.
Choose wisely, and enhance your Power BI reports and DAX skills from good to great!
Want to elevate your Power BI and DAX knowledge further, hop here:
👉YouTube 👉Medium 👉BuyMeACoffee
I'm having trouble using the RANKX function, and it's really frustrating me! I need some assistance with this task.
Thanks for this. I have now started using RANK for such calculations, feels lot easier