
DAX Is Easy: Running Totals Scenarios Using WINDOW Function
Ditch the DAX headaches! The WINDOW function is your new secret weapon for cumulative sums.


Alright, Power BI enthusiasts! Get ready, because today we're tackling a scenario that's not just "interesting," it's absolutely crucial: running totals (or cumulative sum) calculations. If you're wrangling sales, finance, or pretty much any time-series data, this is your bread and butter, your golden ticket, your everything!
As a Power BI Architect, I've grilled countless brilliant minds during interviews for Power BI and Data Analyst roles. And guess what? My absolute go-to in the scenario-based question section is almost always running totals! Why? Because it’s the ultimate test: it reveals your DAX logic superpowers AND your mastery of data hierarchy.
Now, let's be real. Many BI analysts, especially those with a solid SQL background, often find running totals easier in SQL. And honestly, for anyone transitioning from SQL to DAX in Power BI, this can feel like an unnecessary uphill battle. While DAX does offer a few ways to skin this cat, in this post, I'm laser-focused on one thing: leveraging the super-intuitive WINDOW function to achieve these calculations effortlessly across various mind-blowing scenarios. Prepare to simplify your life!
Scenario 1: Running Total Over Date Field
With the availability of window functions in DAX, many calculations have become easier and more relatable, especially for those coming from a SQL background.
Power BI introduced the WINDOW function, designed to provide a subset of a table to the user based on specific requirements. Let’s explore how we can leverage the WINDOW function to calculate the running total with a Date field.
First, in the screenshots below, you can see the table displaying the running total using the WINDOW function (highlighted in pink), along with the corresponding DAX code snippet.
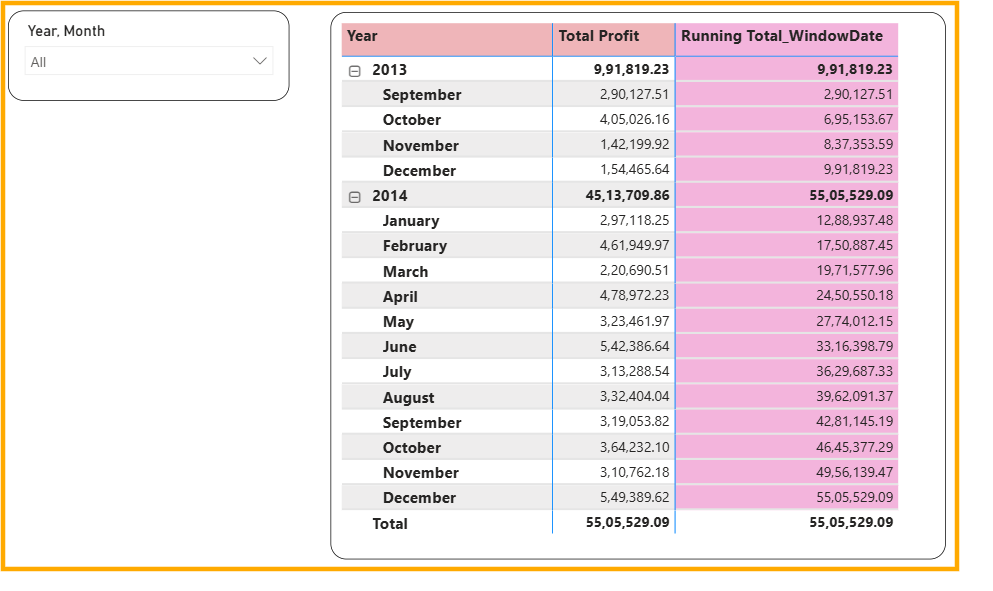
As you can see, I have used Date (Year and Month) fields in the table visuals, and the measure Running Total_WindowDate shows the running total accurately.
Now, let’s look at the DAX expression for the Running Total_WindowDate measure. Later, I will explain how the measure works.

Now, let me explain how this measure works. As you can see, the expression involves CALCULATE in combination with the WINDOW function.
Let’s first delve into how the WINDOW function operates here. I’ve set the first argument of the function as 1, indicating the start position, and the second argument as ABS, signifying Absolute. This ensures that every subset the window creates in each iteration always begins from row 1 in the current context, such as the September 2013 row in this case.
The third argument is set to 0, and the fourth to REL, meaning Relative. A value of 0 for REL signifies that in every iteration, the subset extends up to the current row. For instance, when the iteration is on the January 2014 row, the subset will contain dates from September 2013 to January 2014.
The next argument defines the relation, essentially specifying a table used as a reference to create the subset. Here, the ALLSELECTED function is used to generate a table with dates available in the current context, i.e., the dates visible in the table visual. This table includes dates from September 2013 to December 2014.
Finally, the ORDERBY function is used to ensure that dates are sorted in ascending order, from the oldest to the latest.
Once you have the subset of data using WINDOW for each iteration, CALCULATE computes the total sum of profit for each subset.
And with that, we get the expected running total in the table visual.
Scenario 2: Running Total Over Non-Date Field
The beauty of using the WINDOW function for running totals is that it does not require major changes when dealing with non-date fields. That’s why I call the WINDOW function quite dynamic.
The only prerequisite here is that you'll need to ensure your table visual is sorted consistently.
Here’s the concise DAX expression that works like a charm👇:

As you can see above, it’s quite easy, right? In this case, I’ve used the Country field and computed the running total of profit.
Scenario 3: Running Total Over Partitioned Data
This is again quite simple to implement. Let’s say, in Scenario 1, we want the running total for each year, meaning the running total should reset at the end of each year (2013) and a fresh calculation should start with the next year (2014).
For this implementation, we just need to add the PARTITIONBY clause in the WINDOW expression.
Check the screenshot of the implementation below:

As you can see, I have inserted the PARTITIONBY function with the Year field to partition the data for the subset in WINDOW. One thing to keep in mind is to ensure that the field used in PARTITIONBY is added in the relation argument, like here I added Year in the ALLSELECTED expression.
And with this, we are done, and our running total works like a charm using the WINDOW function even on partitioned data.
Conclusion
The WINDOW function in DAX is a powerful tool that actually simplifies running total calculations, whether dealing with date fields, non-date fields, or partitioned data. By understanding and leveraging this function, you can make your data analysis more efficient and insightful.
And with this, I’ll wrap the things. Until next time, Happy analyzing!
Making Power BI and DAX look easy, one post at a time!
Currently taking a PowerBI course and saving this for when I'll need it. Thank you for posting
Nicely explained. I do find SQL running totals easier to understand, but that’s because I’ve been using it for much longer.