


Your Power BI Files Are Too Big: Here's How to Cut Upto 99%!
Don't Skip This: A Crucial BI Method You Might Be Neglecting

So glad you're here for my very first Substack! Instead of a drawn-out 'about me,' I thought we'd just jump right into a topic I've been genuinely excited about, giving you a real feel for the discussions we'll be having here.
But why the need for smaller .PBIX files?
When working with large data models, report performance is often our biggest concern. As a Power BI Architect, I've designed a variety of data models—from those with just hundreds of rows to massive ones containing billions. Across the board, the most frequent request from clients is for an optimized dashboard.
While numerous strategies exist to enhance data model performance, the fundamental step is always to reduce its size. Power BI models in Import mode load data that is compressed and optimized by the VertiPaq storage engine. This process can achieve remarkable compression, often up to 10x from the source data size.
Despite VertiPaq storage engine efficiency, it’s important that you take steps to minimize the data that is loaded into your models.
This can be achieved through several straightforward steps. In this blog, I'll focus on one of the easiest and most effective methods. For demonstration, I'll be using a sample Sales dataset with daily sales data.

Remember, reporting and BI needs always depend on what your clients expect. So, consider this scenario:
You are tasked with creating dashboards using a dataset to show sales analysis at the month and year level.
Before we start, here is a snapshot of the dataset file size:

Power BI file size is ~ 37 MB
The Trick No One Talks About: Aggregation
When it comes to creating dashboards with optimal performance, many of you have likely heard this phrase:
Always pull the relevant data into Power BI!
While this advice is self-explanatory, its execution in practice can be quite challenging.
This is precisely where Aggregation comes into play. It's a powerful technique beneficial for any connection type—Composite, DirectQuery, or Import—and can significantly optimize your report performance, especially when dealing with large data volumes.
The only crucial factor to consider is the type of reporting analysis you intend to perform. In this scenario, the goal is to conduct monthly analysis on sales data. Therefore, instead of loading all the raw data, we'll aggregate the table at the month level before loading it. We'll also ensure we only pull the necessary fields required for reporting purposes.
Here is the step-by-step implementation:
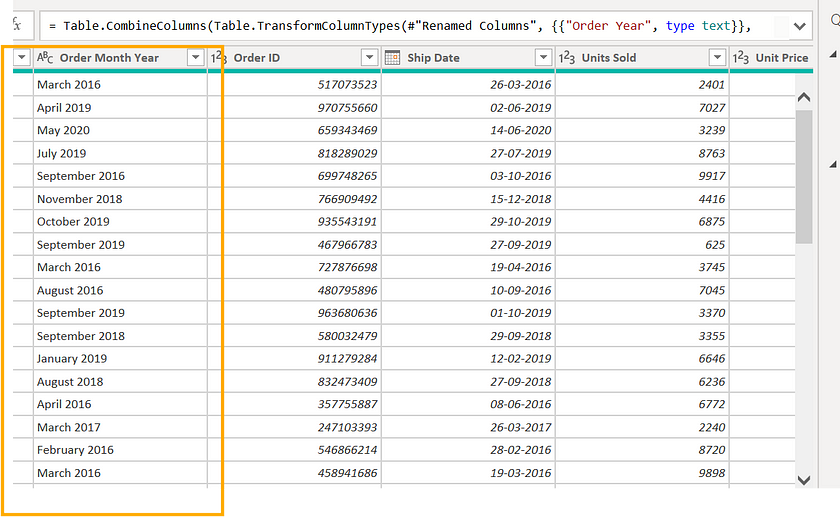
Step 1: Extracting Month & Year from the Order Date field
As you can see from the screenshots below from the power query transformation window — I have extracted the month and year from the Order Date field into a new column Order Month Year.
Step 2: Aggregate the data using Group By option:
Go to the Transform tab and select the Group By option. A new window will pop up.
In this Group By window, select the Advanced option and add your grouping fields. For this scenario, I have added Order Month Year, Region, Country, and Sales Channel.
Then, under Aggregations, add your three key measures: Total Revenue, Total Cost, and Total Profit, all with the Sum operation.
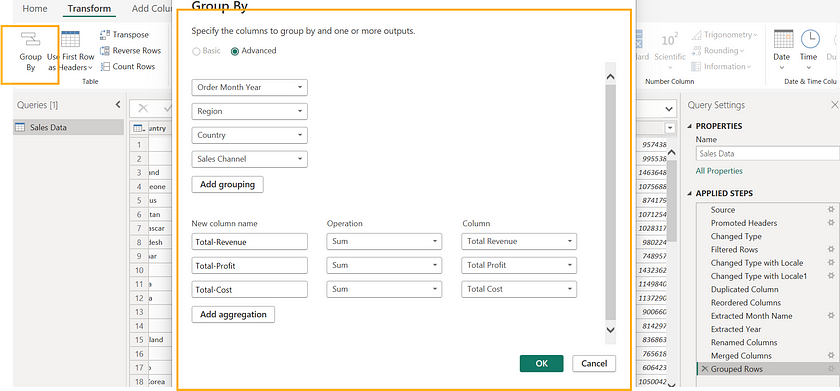
Essentially, by using the Group By feature, we aggregated the data as [Order Month Year], [Region], [Country], and [Sales Channel]. These 4 attribute fields will now be used to create charts as per the requirement.
Once you are done loading the changes, you are in for a surprise!!!
Here is the updated file size after the aggregation transformation:

Boom! the file size is now just around ~1 MB.
That’s the immense power of Aggregation.
Its more than 97% reduction in size from the original file size of 37 MB!
Wasn’t that easy?
Indeed it was! Sometimes, what appear to be big problems actually require just a simple solution.
And here we are, at the end of this piece. Having an optimized data model and dashboard is a luxury that every BI developer desires but not everyone achieves. In this article, I've highlighted Aggregation using Group By—a simple yet profoundly effective method that can drastically reduce your data model size, ultimately leading to significantly better-performing reports and dashboards.
What to expect from me!
If you've read this far, chances are you're already hooked (or just about to hit that 'Subscribe' button!). So, what's next? This Substack is where I'll demystify Power BI and DAX, alongside deep dives into Data Model Design, Microsoft Fabric, Copilot, Power Query, Embedding, and virtually anything else touching the Power BI ecosystem.
Goal is to Make Power BI and DAX look easy!
Subscribe for free to receive new posts and support my work.
That's an effective use of Group by. I admit, have rarely used it